PGObserver

The PGObserver tool was developed at Zalando during the past years to monitor performance metrics of our different PostgreSQL clusters. Due to our use of a stored procedure (SProc) API layer our strong focus was on monitoring that API layer. However the number of metrics was increased to include other metrics relevant to PostgreSQL performance:
SProc Data
Number of calls.
Run time per procedure.
Self time per procedure.
Table IO Stats
Sequential and index scans.
Inserts, (hot) updates, deletes.
Table and index sizes.
Cache hits vs disk hits.
And more...
CPU load is tracked
WAL amount written is tracked
Screenshots

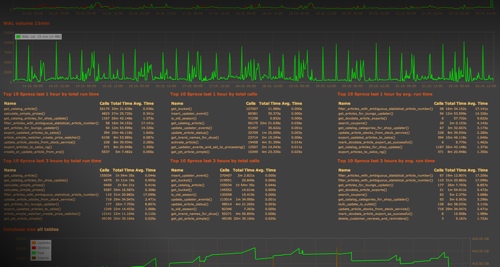
Dashboard with top stored procedures for the last 1 and 3 hours. Displaying top 10 by number of calls, total time spend, and average run time. These values can be customized on the configuration file.

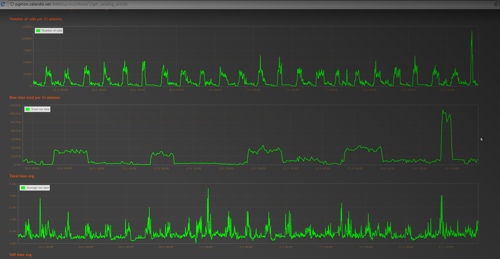
General stats about a specific stored procedure. These graphs are all rendered on the browser, so you can use the mouse to zoom in and out to specific time frames.

Graphs showing CPU load and time spend in stored procedures, quickly showing displaying if something is of, e.g., lock contention.
Setup and Configuration
Basically PGObserver consists of two components, a Python web frontend plus a Java data gatherer. One gatherer takes care of monitoring a defined set of PostgreSQL databases and snapshotting the performance views in defined intervals. The amount of snapshots can be configured on a per database per metric way, giving you more flexibility what you want to monitor and how much data will be created. You can setup more than one gatherer, if required, each with its own set of clusters to monitor.